

Use BigQuery agent analytics
BigQuery agent analytics is an open source solution that lets you capture, analyze, and visualize multimodal agent interaction data at scale by streaming raw agent interactions—such as requests, responses, tool calls, and errors—directly into BigQuery. This solution lets you perform AI-powered evaluations, optimize agent prompts, and extract long-term memory to enhance future interactions. BigQuery agent analytics is supported in Agent Development Kit (ADK) and LangGraph (Preview).
Architecture
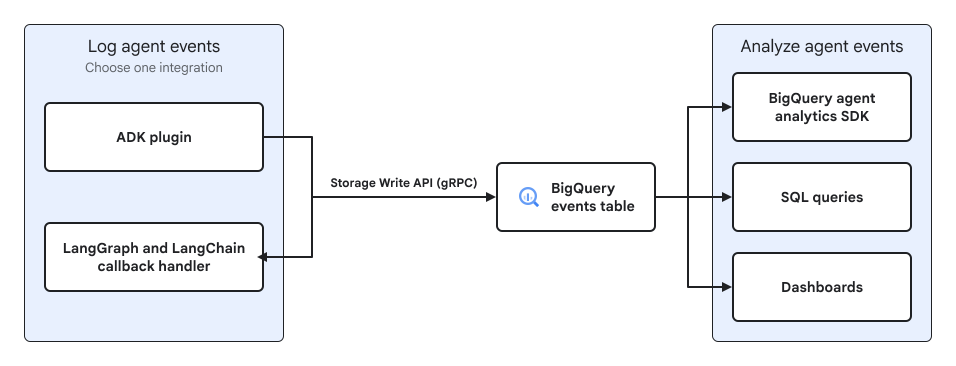
BigQuery agent analytics streams agent activity data to BigQuery using the BigQuery Storage Write API (gRPC), which provides high-throughput, low-latency log streaming without blocking agent execution.
The data flow consists of these stages:
- Capture. Use a logging plugin in ADK or a callback handler in LangGraph to intercept and capture agent interaction events.
- Stream. Interaction events are sent to BigQuery through the Storage Write API (gRPC). If a standardized schema doesn't exist, the agent creates one automatically.
- Consume. Analyze and evaluate logged agent data. You can query raw data with SQL, track metrics on custom dashboards, or use the BigQuery agent analytics SDK to reconstruct and evaluate complex multi-turn agent execution traces.

Agent analytics benefits
- Enable comprehensive logging with a single line of code and automate schema management.
- Log and analyze multimodal data, such as text, images, video, and audio, by using object tables.
- Track operational metrics, such as token consumption and latency, within a robust, predefined schema.
- Identify optimization opportunities by using BigQuery generative AI functions and vector search.
- Secure agent logs with granular access controls, data masking, and encryption.
Choose a library for each workflow stage
BigQuery agent analytics has two logging integrations and one analysis SDK. The logging integrations and the analysis SDK serve different stages of your workflow:
- Log agent events: use the logging integration for your agent framework, either the ADK plugin or the LangGraph and LangChain callback handler. You need only one logging integration, and you don't need the analysis SDK to log events. For other frameworks, or to enable built-in conversation logging for conversational analytics data agents, see Ways to capture agent log data.
- Analyze agent events: use the BigQuery agent analytics SDK to query, reconstruct, and evaluate the logged events. You can also analyze the events with SQL queries and dashboards.
The following diagram shows which library to use at each workflow stage:
The following table describes each logging integration and the analysis SDK:
| Workflow stage | Integration or SDK | Package and entry point | When to use it |
|---|---|---|---|
| Log agent events | ADK BigQuery agent analytics plugin |
For other languages, such as Java, see the ADK plugin guide. |
Use in an ADK agent to stream LLM requests, tool calls, and workflow events to BigQuery. |
| Log agent events | LangGraph and LangChain BigQuery callback handler (Preview) |
|
Use in a LangGraph or LangChain application to stream agent execution events to BigQuery. |
| Analyze agent events | BigQuery agent analytics SDK |
|
Use in evaluation pipelines, notebooks, or audit services to read the events table that your logging integration writes to, reconstruct multi-turn sessions, and run automated evaluations. |
Ways to capture agent log data
To capture your agent's interaction telemetry (requests, responses, tool calls, and error logs) natively into BigQuery, you can log event data in several ways:
- Orchestration framework plugins: use standard logging plugins provided
by your agent orchestration toolkit. For example, the
BigQueryAgentAnalyticsPluginin ADK hooks into the agent runner to automatically intercept, serialize, and stream events. - Framework callback handlers: integrate standard callbacks in popular
agent environments. For example, you can use the
BigQueryCallbackHandlerfrom thelangchain-google-communitypackage in LangGraph and LangChain to intercept and forward traces to BigQuery. - Direct API ingestion: for custom or proprietary frameworks, use the Google Cloud client libraries to stream structured events directly to your events table using the Storage Write API (gRPC).
- Conversational analytics data agents: enable built-in conversation logging when you configure settings for a BigQuery data agent in BigQuery Studio or through the Conversational Analytics API to automatically stream conversation events to a destination BigQuery table and analyze conversation logs.
Regardless of the method, all logging options use the low-latency, high-throughput BigQuery Storage Write API (gRPC). This API provides a robust streaming endpoint that buffers and serializes rows (using the PyArrow engine) asynchronously in memory before committing them, ensuring that observability pipeline tasks don't block your user-facing agent execution turns.
Ways to analyze agent log data
To understand and optimize your agent's performance, analyze and evaluate interaction logs in the following ways:
- Direct SQL queries: run custom queries in BigQuery to
compute metrics like token consumption and execution latency. You can also
use
AI.GENERATEfor automated root-cause analysis of errors, or perform joins with business tables to measure business impact. - Interactive dashboards: connect visualization tools like Data Studio to prebuilt or custom BigQuery views to track agent health, error rates, and usage trends over time. Looker customers can also use a prebuilt BigQuery Agent Analytics dashboard template (Looker Block) from the Looker Marketplace.
- Jupyter notebooks: explore and experiment with log data using Python libraries, pandas, or BigFrames in interactive environments.
- Python SDK: programmatically query, reconstruct, and audit agent execution traces directly in your application code or automated evaluation pipelines.
Examples of working with agent log data
The following are common use cases and examples of working with agent log data in BigQuery.
Observability and operational metrics
- Query data to break down costs by agent flows and determine if a specific agent, such as a refinement agent, consumes a disproportionate amount of tokens compared to its contribution to final responses.
- Use the BigQuery conversational analytics agent
for AI-powered root cause analysis by running queries with the
AI.GENERATEfunction. For example, "Analyze this conversation log and explain the root cause of the failure."
Agent evaluation and quality analysis
- Rank conversations and measure agent rank over time by using the
AI.SCOREfunction. - Identify conversation clusters where the agent failed to assist users by using a SQL query with Vector Search, and then compare them to the user's original intent. This helps you identify gaps in the agent's tools or knowledge base.
Business insights and contextualization
To contextualize agent data, join the agent_events table with other business
tables. For example, show the average order value (AOV) for customers who
interacted with the AI agent versus customers who used the search bar.
For more examples, see the query recipes.
Use a Jupyter notebook to work with agent logs
Use this example Colab Jupyter notebook to interactively query, visualize, and evaluate agent logs.
Use the BigQuery agent analytics SDK
The BigQuery agent analytics SDK is an open-source Python library that provides a consumption and evaluation layer for long-term agent observability. Dashboards and notebooks are excellent for ad hoc exploration, and the SDK provides a way to systematically analyze and audit agent behavior at scale.
What you can do with the SDK
You can perform the following tasks using the BigQuery agent analytics SDK. For detailed examples of log analysis, see the GitHub repository for the SDK.
- Trace reconstruction: reconstruct polymorphic event logs into causal chains of events to debug sessions across multiple turns, including nested tool and LLM calls.
- Deterministic and semantic evaluation: assess agent quality against rule-based criteria, such as latency, turn counts, and error rates, as well as semantic criteria, such as correctness, sentiment, and hallucination.
- Trajectory matching: compare actual agent execution paths against expected golden trajectories to verify step efficiency and whether tools were used in the correct order.
- Behavioral monitoring and drift detection: perform statistical analyses over non-deterministic agent outputs, monitor user request distributions, and detect production regression or semantic drift.
- Long-horizon agent memory: provide agents with cross-session context, user profile semantic retrieval, and token-budget-aware episodic memory stored natively in BigQuery.
Log and analyze agent activity
The SDK reads and evaluates events that a logging integration writes. A typical workflow involves the following steps:
- Log interactions: in your agent orchestration framework, attach a
logging integration, such as the
BigQueryAgentAnalyticsPluginin ADK or theBigQueryCallbackHandlerin LangGraph. When users interact with your agent, the integration streams the events asynchronously to BigQuery by using the high-throughput Storage Write API (gRPC). This step doesn't require the SDK. Initialize the client: connect to your log dataset from the Python SDK:
from google.cloud import bigquery
from bigquery_agent_analytics import Client

client = Client(
    project_id="YOUR_PROJECT_ID",
    dataset_id="YOUR_DATASET_ID",
    table_id="agent_events",
)
The snippet uses the following components:
client: the parentClientinstance that programmatically routes queries and manages active database connections.project_id: the Google Cloud project ID housing the target dataset.dataset_id: the BigQuery dataset name storing logs.table_id: the table that stores the logged events (agent_eventsby default). This value must match the table that your logging integration writes to. For example,BigQueryCallbackHandlerinlangchain-google-communityversion 4.0.0 and earlier writes toagent_events_v2by default.
Reconstruct a session trace: fetch a specific conversation session to visualize and review the exact sequence of events:
trace = client.get_session_trace(
    session_id="YOUR_SESSION_ID"
)
trace.render()
The snippet uses the following components:
trace: the hydratedTraceobject housing the reconstructed causally linked hierarchical DAG span tree of all user and agent actions.YOUR_SESSION_ID: the unique ID of the session you want to inspect.
Run automated evaluations: programmatically score session trajectories or check for regression against a golden test suite:
from bigquery_agent_analytics import (
    LLMAsJudge,
    TraceFilter,
)

# Run semantic evaluations across target sessions
evaluator = LLMAsJudge.correctness()
filters = TraceFilter(session_ids=["session_1", "session_2"])

report = client.evaluate(evaluator, filters=filters)
print(f"Evaluation Pass Rate: {report.pass_rate:.2%}")
The snippet uses the following components:
evaluator: the semantic (LLMAsJudge) evaluator used to score sessions (you can also run rule-basedSystemEvaluatorchecks or combine evaluators into a weightedGraderPipeline).filters: theTraceFilterinstance specifying thesession_idslist (or time window and agent filters) to run batch evaluations against in BigQuery.report: the resultingEvaluationReportobject containing raw session grades, metric summaries, and auto-rater feedback.
Integrate BigQuery agent analytics into your workflow
To integrate BigQuery agent analytics into your workflow, do the following:
Set up the logging integration for your agent framework:
Analyze the logged events with the BigQuery agent analytics SDK, the example Colab notebook, or the SQL query recipes.