

By default, the Ops Agent and the legacy Monitoring agent are configured to
collect metrics that capture information about the processes running on your
Compute Engine virtual machines (VMs). You can also collect these metrics
on Amazon Elastic Compute Cloud (EC2) VMs by using the Monitoring agent.
This set of metrics, called process metrics, is identifiable by
the prefix agent.googleapis.com/processes. These metrics
are not collected on Google Kubernetes Engine (GKE).
As of August 6, 2021, charges will be introduced for these metrics, as described in the chargeable metrics section of the Google Cloud Observability pricing page. The set of process metrics is classified as chargeable, but charges have never been implemented.
This document describes tools for visualizing process metrics, how to determine the amount of data you are ingesting from these metrics, and how to to minimize the related charges.
Working with process metrics
You can visualize your process-metric data with charts created by using Metrics Explorer or custom dashboards. For more information, see Using dashboards and charts. In addition, Cloud Monitoring includes data from process metrics on two predefined dashboards:
- VM Instances dashboard in Monitoring
- VM instance Details dashboard in Compute Engine
The following sections describe these dashboards.
Monitoring: View aggregated process metrics
To view aggregated process metrics within a metrics scope, go to the Processes tab on the VM Instances dashboard:
-
In the Google Cloud console, go to the Dashboards page:
If you use the search bar to find this page, then select the result whose subheading is Monitoring.
Select the VM Instances dashboard from the list.
Click Processes.
The following screenshot shows an example of the Monitoring Processes page:
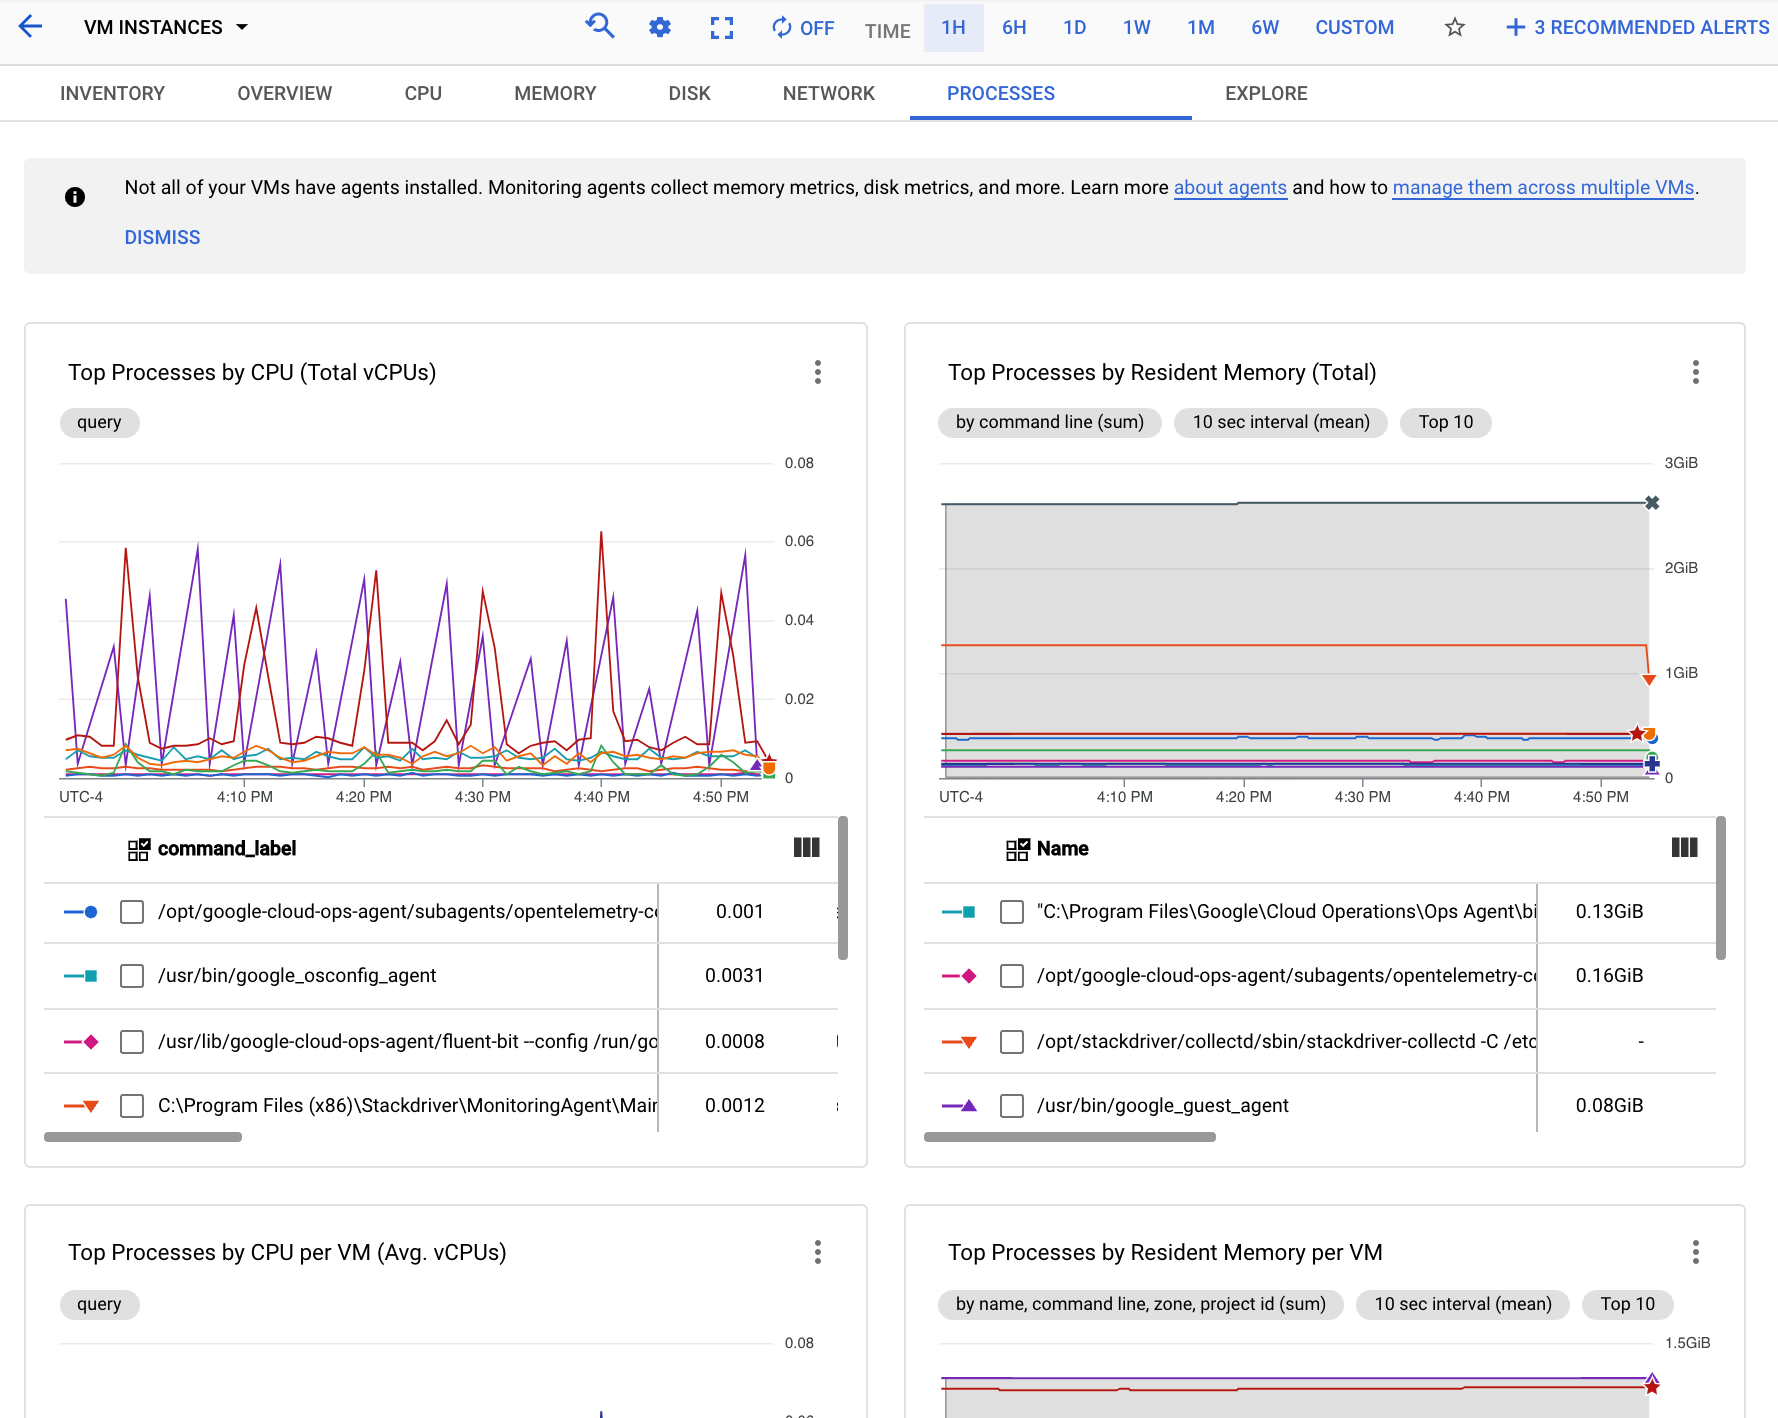
You can use the charts on the Processes tab to identify the processes in your metrics scope that are consuming the most CPU and memory, and that have the highest disk utilization.
Compute Engine: View performance metrics for top resource-consuming VMs
To view the performance charts showing the five VMs consuming the most of a resource in your Google Cloud project, go to the Observability tab for your VM instances:
-
In the Google Cloud console, go to the VM instances page:
If you use the search bar to find this page, then select the result whose subheading is Compute Engine.
- Click Observability.
The following screenshot shows an example of the Compute Engine Observability page.

For information about using these metrics to diagnose problems with your VMs, see Troubleshooting VM performance issues.
Compute Engine: View per-VM process metrics
To view a list of the processes running on a single Compute Engine virtual machine (VM) and charts for the processes with the highest resource consumption, go to the Observability tab for the VM:
-
In the Google Cloud console, go to the VM instances page:
If you use the search bar to find this page, then select the result whose subheading is Compute Engine.
On the Instances tab, click the name of a VM to inspect.
Click Observability to view the metrics for this VM.
In the navigation pane on the Observability tab, select Processes.
The following screenshot shows an example of the Compute Engine Processes page:

Process metrics are retained for up to 24 months, so you can use them to look back in time and attribute anomalies in resource consumption to specific processes or identify your most expensive resource consumers. For example, the following chart shows the processes consuming the highest percentages of CPU resources. You can use the time-range selector to change the time range of the chart. The time-range selector offers preset values, like the most recent hour, and also lets you input a custom time range.

The Running Processes table provides a listing of resource consumption
analogous to the output of the Linux top command.
By default, the table shows a snapshot of the most recent data.
However, if you select a range of time on a chart that ends in the past,
the table shows the processes running at the end of that range.
For information about using these metrics to diagnose problems with your VMs, see Troubleshooting VM performance issues.
Process metrics collected by the agent
The Linux agents collect all of the metrics listed in the following table from processes running on Compute Engine VMs and, by using the Monitoring agent, Amazon Elastic Compute Cloud (EC2) VMs. You can disable their collection by the Ops Agent (versions 2.0.0 and higher) and by the legacy Monitoring agent.
You can also disable collection of process metrics for the Ops Agent (versions 2.0.0 and higher) running on Windows VMs.
For more information, see Disabling process metrics.
If you want to disable collection of these metrics on Windows, we recommend that you upgrade to the Ops Agent version 2.0.0 or higher. For more information, see Installing the Ops Agent.
Table of process metrics
Determining current ingestion
You can use Metrics Explorer to see how much data you are ingesting for process metrics. Use the following procedure:
-
In the Google Cloud console, go to the leaderboard Metrics explorer page:
If you use the search bar to find this page, then select the result whose subheading is Monitoring.
In the toolbar of the query-builder pane, select the button whose name is code PromQL.
To see the total number of process-metric points for your
gce_instanceandaws_ec2_instanceresources, do the following:Enter the following query:
sum_over_time(
  sum by (resource_type) (
    label_replace(
      label_replace(
        sum(count_over_time({"agent.googleapis.com/processes/cpu_time", monitored_resource="gce_instance"}[1m])),
        "metric_suffix", "cpu_time", "", ""
      )
      or
      label_replace(
        sum(count_over_time({"agent.googleapis.com/processes/disk/read_bytes_count", monitored_resource="gce_instance"}[1m])),
        "metric_suffix", "disk_read_bytes_count", "", ""
      )
      or
      label_replace(
        sum(count_over_time({"agent.googleapis.com/processes/disk/write_bytes_count", monitored_resource="gce_instance"}[1m])),
        "metric_suffix", "disk_write_bytes_count", "", ""
      )
      or
      label_replace(
        sum(count_over_time({"agent.googleapis.com/processes/rss_usage", monitored_resource="gce_instance"}[1m])),
        "metric_suffix", "rss_usage", "", ""
      )
      or
      label_replace(
        sum(count_over_time({"agent.googleapis.com/processes/vm_usage", monitored_resource="gce_instance"}[1m])),
        "metric_suffix", "vm_usage", "", ""
      )
      or
      label_replace(
        sum(count_over_time({"agent.googleapis.com/processes/count_by_state", monitored_resource="gce_instance"}[1m])),
        "metric_suffix", "count_by_state", "", ""
      )
      or
      label_replace(
        sum(count_over_time({"agent.googleapis.com/processes/fork_count", monitored_resource="gce_instance"}[1m])),
        "metric_suffix", "fork_count", "", ""
      ),
      "resource_type", "gce_instance", "", ""
    )
    or
    label_replace(
      label_replace(
        sum(count_over_time({"agent.googleapis.com/processes/cpu_time", monitored_resource="aws_ec2_instance"}[1m])),
        "metric_suffix", "cpu_time", "", ""
      )
      or
      label_replace(
        sum(count_over_time({"agent.googleapis.com/processes/disk/read_bytes_count", monitored_resource="aws_ec2_instance"}[1m])),
        "metric_suffix", "disk_read_bytes_count", "", ""
      )
      or
      label_replace(
        sum(count_over_time({"agent.googleapis.com/processes/disk/write_bytes_count", monitored_resource="aws_ec2_instance"}[1m])),
        "metric_suffix", "disk_write_bytes_count", "", ""
      )
      or
      label_replace(
        sum(count_over_time({"agent.googleapis.com/processes/rss_usage", monitored_resource="aws_ec2_instance"}[1m])),
        "metric_suffix", "rss_usage", "", ""
      )
      or
      label_replace(
        sum(count_over_time({"agent.googleapis.com/processes/vm_usage", monitored_resource="aws_ec2_instance"}[1m])),
        "metric_suffix", "vm_usage", "", ""
      )
      or
      label_replace(
        sum(count_over_time({"agent.googleapis.com/processes/count_by_state", monitored_resource="aws_ec2_instance"}[1m])),
        "metric_suffix", "count_by_state", "", ""
      )
      or
      label_replace(
        sum(count_over_time({"agent.googleapis.com/processes/fork_count", monitored_resource="aws_ec2_instance"}[1m])),
        "metric_suffix", "fork_count", "", ""
      ),
      "resource_type", "aws_ec2_instance", "", ""
    )
  )[1d:]
)
Click Run Query. The resulting chart shows you the values for each resource type.
Disable collection of process metrics
There are multiple ways you can disable the collection of these metrics by the Ops Agent (versions 2.0.0 and higher) and by the legacy Monitoring agent on Linux.
The agents run only on Compute Engine VMs; these procedures apply only to that platform.
You can't disable collection by the Ops Agent if you are running versions less than 2.0.0 or the legacy Monitoring agent on Windows. If you want to disable collection of these metrics on Windows, we recommend that you upgrade to the Ops Agent version 2.0.0 or higher. For more information, see Installing the Ops Agent.
The general procedure looks like this:
Connect to the VM.
Make a copy of the existing configuration file as a back up. Store the back-up copy outside the agent's configuration directory, so the agent doesn't attempt to load both files. For example, the following command makes a copy of the configuration file for the Monitoring agent on Linux:
cp /etc/stackdriver/collectd.conf BACKUP_DIR/collectd.conf.bak
Change the configuration using one of the options described in the following:
Restart the agent, to pick up the new configuration:
- Monitoring agent:
sudo service stackdriver-agent restart - Ops Agent:
sudo service google-cloud-ops-agent restart
- Monitoring agent:
Verify that the process metrics are no longer being collected for this VM:
-
In the Google Cloud console, go to the leaderboard Metrics explorer page:
If you use the search bar to find this page, then select the result whose subheading is Monitoring.
In the toolbar of the query-builder pane, select the button whose name is code PromQL.
For a
gce_instanceresource, enter the following query, replacing VM_NAME with the name of this VM:rate({"agent.googleapis.com/processes/cpu_time", monitored_resource="gce_instance", metadata_system_name="VM_NAME"}[1m])Click Run Query.
-
Ops Agent on Linux or Windows
The location of the configuration file for the Ops Agent depends on the operating system:
- For Linux:
/etc/google-cloud-ops-agent/config.yaml - For Windows:
C:\Program Files\Google\Cloud Operations\Ops
Agent\config\config.yaml
To disable the collection of all process metrics by the Ops Agent,
add the following to your config.yaml file:
metrics:
  processors:
    metrics_filter:
      type: exclude_metrics
      metrics_pattern:
      - agent.googleapis.com/processes/*
This excludes process metrics from collection in the metrics_filter
processor that applies to the default pipeline in the metrics service.
For more information about configuration options for the Ops Agent, see Configuring the Ops Agent.
Monitoring agent on Linux
You have the following options for disabling the collection of process metrics with the legacy Monitoring agent:
The following sections describe each option and list the benefits and risks associated with that option.
Modify the agent's configuration file
With this option, you directly edit the agent's main configuration file,
/etc/stackdriver/collectd.conf, to remove the sections
that enable the collection of the process metrics.
Procedure
There are three groups of deletions you need to make to the
collectd.conf file:
Delete the following
LoadPlugindirective and plugin configuration:LoadPlugin processes <Plugin "processes"> ProcessMatch "all" ".*" Detail "ps_cputime" Detail "ps_disk_octets" Detail "ps_rss" Detail "ps_vm" </Plugin>Delete the following
PostCacheChaindirective and the configuration of thePostCachechain:PostCacheChain "PostCache" <Chain "PostCache"> <Rule "processes"> <Match "regex"> Plugin "^processes$" Type "^(ps_cputime|disk_octets|ps_rss|ps_vm)$" </Match> <Target "jump"> Chain "MaybeThrottleProcesses" </Target> Target "stop" </Rule> <Rule "otherwise"> <Match "throttle_metadata_keys"> OKToThrottle false HighWaterMark 5700000000 # 950M * 6 LowWaterMark 4800000000 # 800M * 6 </Match> <Target "write"> Plugin "write_gcm" </Target> </Rule> </Chain>Delete the
MaybeThrottleProcesseschain used by thePostCachechain:<Chain "MaybeThrottleProcesses"> <Rule "default"> <Match "throttle_metadata_keys"> OKToThrottle true TrackedMetadata "processes:pid" TrackedMetadata "processes:command" TrackedMetadata "processes:command_line" TrackedMetadata "processes:owner" </Match> <Target "write"> Plugin "write_gcm" </Target> </Rule> </Chain>
Benefits and risks
- Benefits
- You reduce the resources consumed by the agent, because the metrics are never collected.
- If you have made other changes to your
collectd.conffile, you might be able to easily preserve those changes.
- Risks
- You must use the
rootaccount to edit this configuration file. - You risk introducing typographical errors into the file.
- You must use the
Replace the agent's configuration file
With this option, you replace the agent's main configuration file with a pre-edited version that has the relevant sections removed for you.
Procedure
Download the pre-edited file,
collectd-no-process-metrics.conf, from the GitHub repository to the/tmpdirectory, and then do the following:cd /tmp && curl -sSO https://raw.githubusercontent.com/Stackdriver/agent-packaging/master/collectd-no-process-metrics.confReplace the existing
collectd.conffile with the pre-edited file:cp /tmp/collectd-no-process-metrics.conf /etc/stackdriver/collectd.conf
Benefits and risks
- Benefits
- You reduce resources consumed by the agent because the metrics are never collected.
- You don't have to manually edit the file as
root. - Configuration-management tools can easily replace a file.
- Risks
- If you have made other changes to the
collectd.conffile, you have to merge those changes into the replacement file.
- If you have made other changes to the
Troubleshooting
The procedures described in this document are changes to the configuration of the agent, so the following problems are most likely:
- Insufficient privilege to edit the configuration files. Configuration
files must be edited from the
rootaccount. - Introduction of typographical errors into the configuration file, if you edit it directly.
For information on resolving other problems, see Troubleshooting the Monitoring agent.
Monitoring agent on Windows
You can't disable the collection of process metrics by the legacy Monitoring agent running on Windows VMs. This agent is not configurable. If you want to disable collection of these metrics on Windows, we recommend that you upgrade to the Ops Agent version 2.0.0 or higher. For more information, see Installing the Ops Agent.
If you are running the Ops Agent, see Ops Agent on Linux or Windows.