

Sankey charts visualize the flow and distribution of data between categories, stages, or states. In Looker, each dimension value represents a stage, and the connecting paths represent the flow from one stage to another. The width of each connection corresponds to a numeric measure value, which helps you identify proportions, drops, or transfers across complex processes.
Sankey charts are especially useful for analyzing multi-step pathways, such as customer journeys, website navigation flows, or resource allocations across different systems.
This page describes the visualization menu options for Sankey charts in Looker.
User and instance requirements
To access Sankey chart options, you must meet the following requirements:
- Your Looker (original) or Looker (Google Cloud core) instance must be running Looker 26.20 or later.
- To view and interact with Explores, including creating visualizations, you
must have the following access:
- The User Looker role
or another role that contains the
explorepermission - Access to the underlying LookML model that the Explore is based on to see and use its fields in a visualization
- The User Looker role
or another role that contains the
Types of Sankey charts
Sankey charts support two data types: Path and Edge list.
Looker automatically applies the Path or Edge list data type based on your query. To change the data type, use the Data type option in the Plot menu. If your query doesn't have the number of dimensions and measures that the selected data type requires, the Sankey chart doesn't render.
Path type Sankey charts visualize the flow of data for queries that have two or more dimensions and one measure. Each dimension is a stage in the chart. For example, the following query tracks user journeys on an ecommerce site and has these fields:
- Source (dimension): how a user arrives at the site
- Page (dimension): the page that the user visits next
- Status (dimension): whether the user subscribed
- Count of Users (measure): the number of users who completed each journey
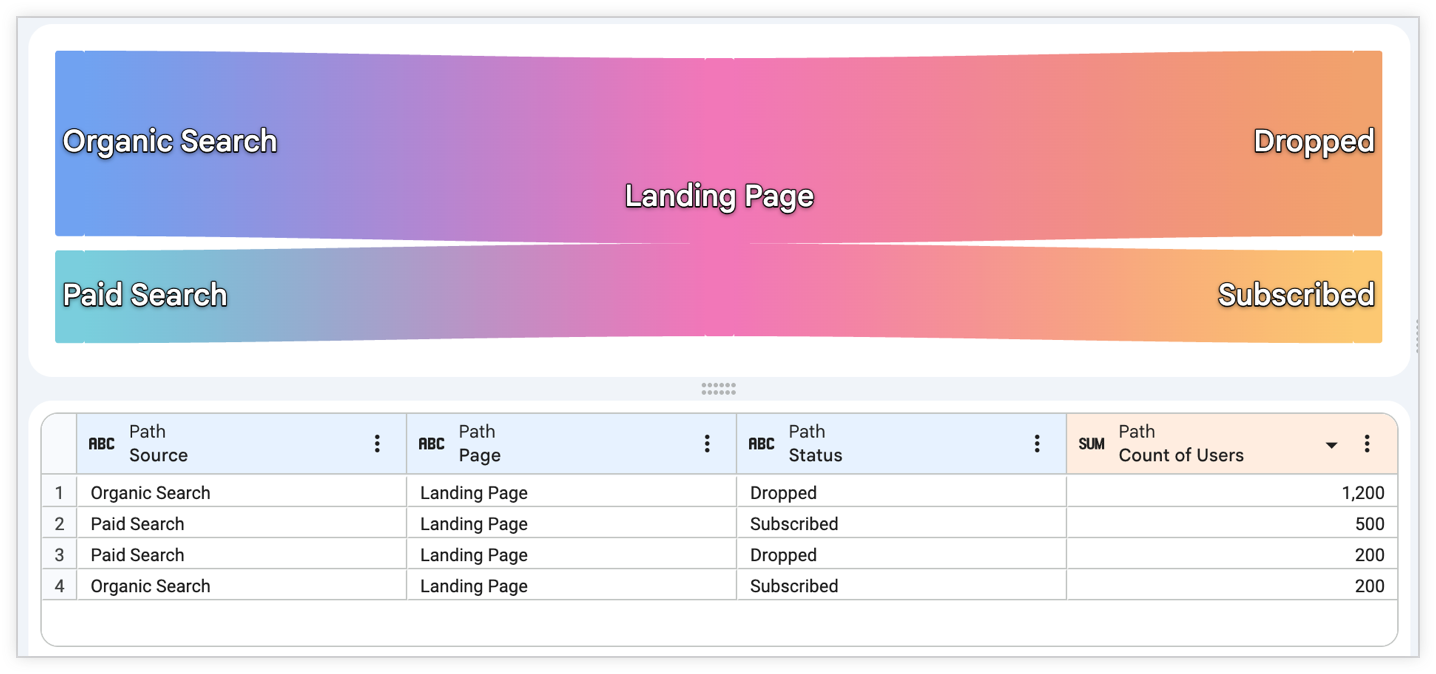
Edge list type Sankey charts visualize the flow of data for queries that have two dimensions and one measure. For example, the following query tracks a similar user journey and has these fields:
- Source (dimension): the starting point of each step in the journey
- Page (dimension): the page that the user navigates to next
- Count of Users (measure): the number of users who completed each step

If a query has two dimensions and one measure, you can also set the data type to Path. A Path type chart displays the same data as a two-stage flow.

For queries that have two dimensions and one measure, choose the most appropriate Sankey chart type for your data.
Things to know
There are a few things to keep in mind when working with Sankey charts in Looker:
- Edge list type Sankey charts support only forward-moving paths. For example, a path such as A > B > A or A > B > C > A doesn't render.
- For Edge list type Sankey charts, Looker automatically orders the stages based on the data.
- For Path type Sankey charts, the order of the dimensions in the query determines the order of the stages in the chart.
- Sankey charts can display a maximum of 500 rows. Queries that exceed this limit are truncated or might cause rendering issues.
Sankey visualization options
To customize your chart, select the Style tab in the Configure panel to access the chart configuration options.
Some options might be unavailable or hidden if they conflict with other settings that you chose or with the data in your query.
Plot menu options
The Plot menu in the Style tab contains the following options for Sankey charts.
Data type
Sets the type of Sankey chart. Choose Path or Edge list from the Data type menu. For more information, see Types of Sankey charts.
Visualization Theme
Sets the theme for the visualization. You can choose either Classic or Modern from the Visualization Theme menu to access the color palettes for each theme in the Series menu.
Link crossfilter by
The Link crossfilter by option lets users click a link in the Sankey chart to cross-filter the other charts on the dashboard by the values in that link. Choose from the following settings:
- Both: When a user clicks a link, the charts on a dashboard are cross-filtered by both the source and the target dimensions.
- Source: When a user clicks a link, the charts on a dashboard are filtered by only the source dimension.
- Target: When a user clicks a link, the charts on a dashboard are filtered by only the target dimension.
Custom Tooltip
You can click the Custom Tooltip switch to configure tooltips within the Explore visualization editor by using a combination of UI settings and an HTML editor that supports Liquid templating. Learn more about Custom Tooltips.
Series menu options
The Series menu in the Style tab includes the following options for Sankey charts.
Colors
The Colors section includes the following options:
- Collection: Choose a color collection from the Colors Collection menu. A collection lets you create themed visualizations and dashboards that look good together. You can see all the palettes in each of Looker's built-in color collections on the Color collections documentation page. Your Looker admin may also create a custom color collection for your organization.
- Select Palettes: To customize the colors further, click the palette swatch to open the color picker menu, and then click a color in one of the palettes. To select a custom color, click the Custom tab of the palette picker, and then either use the color gradient and value slider to choose a custom color, or enter an RGB hex string, such as
#2ca6cd, or a CSS color name, such asmediumblue, into the input field. - Reverse colors: When enabled, reverses the order of colors that are used from a palette. For a categorical palette, the Reverse colors setting applies the last color in the palette to the first series, the second-to-last color in the palette to the second series, and so on. For a sequential or diverging palette, the Reverse colors setting applies the color at the right end of the palette to the first series and moves left on the palette for the remaining series.
- Color by: Choose how the colors are applied to the data in the Sankey chart from the following Color by menu options:
- Node Order: Colors the Sankey chart by the order of the nodes.
- Single Color: Colors the Sankey chart by one color.
- Node Thickness: Sets the thickness of the nodes in the Sankey chart. The higher the value, the thicker the nodes.
- Node Padding: Sets the amount of space between each node in the Sankey chart. The higher the value, the more space between each node.
- Link Color Mode: Sets the color of the links between nodes in the Sankey chart. The following options are available:
- Gradient: The color of the link is displayed as a gradient between the source and target nodes.
- Source: The color of the link is determined by the source node.
- Target: The color of the link is determined by the target node.
Style menu options
The Style menu in the Style tab includes the following options for Sankey charts.
Rounded corners
Turn on the Rounded corners option to apply rounded corners to the nodes in the Sankey chart.
Node Opacity
Sets the opacity of the nodes in the Sankey chart. The higher the value, the more opaque the nodes.
Link Opacity
Sets the opacity of the links in the Sankey chart. The higher the value, the more opaque the links.
Show labels
The Show labels option lets you show or hide the value labels for the nodes in the Sankey chart.
Turning on this setting reveals the following configuration settings for labels:
- Label Font Size: Sets the font size of the labels. You can use any valid CSS size. For example, you can specify a number of pixels, such as
10pxor12px. - Label Font Color: Sets the color of the label. Enter an RGB hex string, such as
#2ca6cd, or a CSS color name, such asmediumblue, into the input field. - Label Font Family: Sets the font family of the label font.
Related resources
After you customize your Sankey chart, you can do the following:
- Save Explore queries as Looks.
- Add Explore queries to dashboards.
- Share data with other users.