

You can blend data in Data Studio to combine information from multiple sources into a single view. From this combined data, you can create charts, tables, and controls. Blending data can help you gain insights that you might not discover when analyzing each data source separately.
You can blend up to five distinct data sources. For example, you can merge customer records with order details from different BigQuery tables to view them in a single table. You can also combine Google Ads and Google Analytics metrics on a time series to evaluate marketing campaign performance.
Before you begin
To get the most out of this guide, make sure that you're familiar with these key concepts:
Differences between blends and data sources
Blending data creates a resource called a blend. Like standard data sources, blends provide data for your report charts and controls. However, they differ in several important ways:
- Blends combine data from multiple data sources.
- Blends are always embedded in the report where you create them. While you can't share a blend across different reports, copying a report also copies its blends so your charts keep working.
- Metrics from the underlying data sources become unaggregated numeric dimensions in the blend. See Blending tips and advanced concepts for details.
- Blends inherit their data freshness and credentials settings directly from the underlying data sources.
How blends work
While database programmers write SQL statements to combine tables, Data Studio lets you blend data without writing any code. You can use the blend editor to configure your blend:
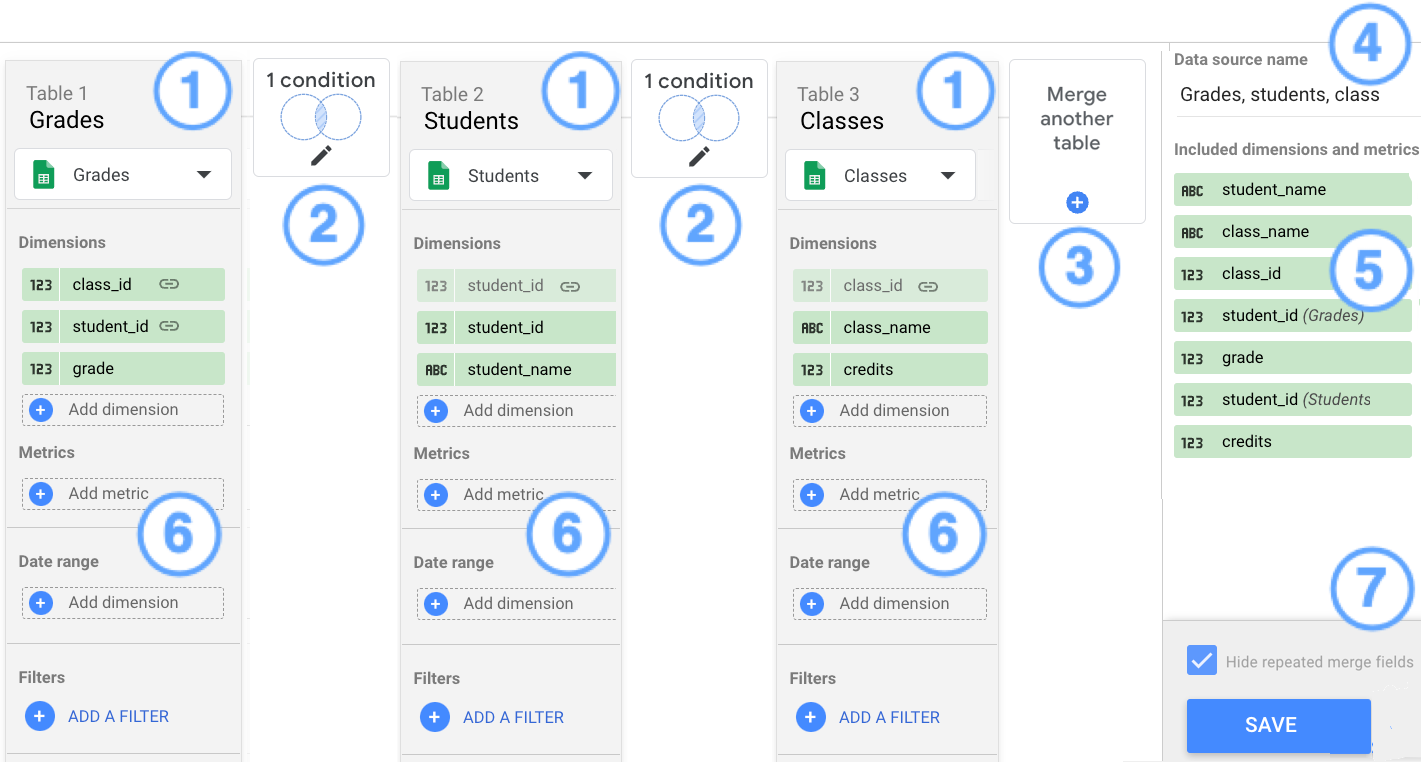
Legend:
- Tables
- Merge configuration
- Merge another table button
- Blend name
- Included dimensions and metrics
- Add metrics, date range, and filters
- Hide repeated merge fields option and SAVE button
Tables
Blends are made up of tables. Each table in the blend editor contains fields that are extracted from an underlying data source. You can include up to five tables in a blend.
Before merging, Data Studio groups and aggregates rows in each table based on its dimensions. If your dimensions don't include a unique identifier for each record, identical rows collapse during this pre-grouping phase. To ensure that each record remains distinct and to prevent row counts from reducing prematurely, add a unique identifier field (like a primary key or row ID) to each table's dimension list.
To add data to a table, click Add dimension or Add metric.
Fields that are used in merge conditions appear with a link icon.
Merge configuration
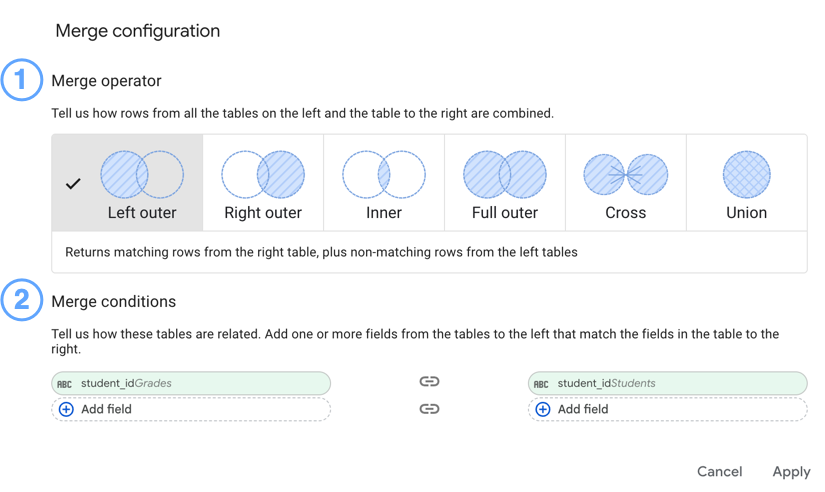
A merge configuration links pairs of tables in a blend. Each merge configuration consists of a merge operator—which defines whether to combine records horizontally (joins) or stack rows vertically (unions)—and merge conditions, which specify how fields from each table are linked or paired.
For example, in the following screenshot, the Grades table joins to the Students table on the student_id field and to the Classes table on the class_id field. Both merge configurations use the Left outer join operator.
Merge operators
The merge operator determines how data from the tables in the blend is combined. Data Studio supports five join operators and the union operator:
- Inner join: Returns only matching rows from the left and right tables.
- Left outer join: Returns matching rows from the right table, plus non-matching rows from the left tables.
- Right outer join: Returns matching rows from the left tables, plus non-matching rows from the right table.
- Full outer join: Returns all rows from the left tables and the right table, whether they match or not.
- Cross join: Returns every possible combination of rows from the left and right tables.
- Union: Appends rows from the right table to the left table, stacking them vertically and removing duplicate rows.
What's the difference between a join and a union?
Both joins and unions let you merge data from different sources or tables. The difference between the two methods lies in how the data is combined: a join combines the data horizontally (by adding columns), while a union combines the data vertically (by adding rows).
Example joins and unions
Expand the following sections for examples of joins and unions.
Join example: Combine data horizontally
A join operation takes two or more tables and links them side-by-side based on a common identifier. Use joins to enrich a dataset by adding columns of information.
Scenario: You want to combine one table that contains a list of customer names with a second table that contains the customers' total sales figures. Both tables must share a common field, like Customer ID, in order to match the rows from the first table to the second table.
| Table 1: Customer Details | Table 2: Sales Data |
|---|
| Customer ID | Customer Name | Customer ID | Total Sales |
|---|---|---|---|
| 101 | Alex | 101 | $5,000 |
| 102 | Jie | 102 | $3,200 |
To blend this data into a single table, you could use the Left outer join operator and link the tables on the Customer ID field. The two tables are merged horizontally into a single, wider table that now includes the Customer Name and Total Sales on the same row.
| Customer ID | Customer Name | Total Sales |
|---|---|---|
| 101 | Alex | $5,000 |
| 102 | Jie | $3,200 |
Union example: Append data vertically
A union operation takes two or more tables with an identical structure (the same columns in the same order) and stacks them on top of one another. Use unions to append one dataset to another so that you can get a more complete picture of your data.
Scenario: You have three separate tables for sales—one for January, one for February, and one for March—and you want to combine them into one dataset for a full quarter analysis.
Table 1: January Sales Report
| Date | Region | Revenue |
|---|---|---|
| Jan 1 | East | $100 |
| Jan 2 | West | $200 |
Table 2: February Sales Report
| Date | Region | Revenue |
|---|---|---|
| Feb 1 | East | $150 |
| Feb 2 | West | $250 |
Table 3: March Sales Report
| Date | Region | Revenue |
|---|---|---|
| Mar 1 | East | $180 |
| Mar 2 | West | $280 |
To create a single table from the three monthly sales tables, you could use the Union operator between the tables. The data will be appended vertically, creating a longer table that preserves all the original columns.
| Date | Region | Revenue |
|---|---|---|
| Jan 1 | East | $100 |
| Jan 2 | West | $200 |
| Feb 1 | East | $150 |
| Feb 2 | West | $250 |
| Mar 1 | East | $180 |
| Mar 2 | West | $280 |
Learn more about join operators in the BigQuery documentation.
Merge conditions
In the Merge conditions section, you define how the fields in each table are linked or paired:
- For joins: A merge condition (or join condition) consists of one or more matching fields that link records between tables. For example, if Campaign Name exists in both a Google Analytics table and a Google Ads table, Data Studio can join the data on that shared field.
- For unions: A merge condition pairs every dimension and metric in the left table with a corresponding field of the same data type in the right table so their values stack into the same column.
For each table in the blend, you select which fields to include in the condition. The fields don't have to share the same name across tables as long as their data matches. For example, to visualize customers, orders, and items in a single chart, your tables might have the following fields:
Customers table
customer_IDcustomer_name
Orders table
cust_idorder_numberorder_total
Items table
order_numberSKU
To blend these tables, you'd join the Customers table with the Orders table, using the customer_ID and cust_id fields as the merge condition, and you'd join the Orders table with the Items table using order_number as the merge condition.
Included dimensions and metrics
Any fields that are used in the merge conditions of the blend, plus any additional dimensions or metrics that you add to the blend, are listed in the Included dimensions and metrics section. These are the fields that you'll be able to use in any charts that are based on the blend.
Hide repeated merge fields
The Hide repeated merge fields option excludes duplicated fields that are used in merge conditions. To include repeated merge fields in a join blend, clear this option.
For example, say you are joining three tables: Grades, Students, and Classes, using student_id and class_id fields in the merge configuration. With the Hide repeated merge fields option selected, the blend includes only one instance of student_id and class_id.

For the same blend configuration, with the Hide repeated merge fields option cleared, the blend now includes multiple instances of student_id and class_id, along with the name of the table in which that field appears, for example, class_id (Grades), class_id (Classes), student_id (Grades), and student_id (Students).

For union blends, the Hide repeated merge fields option is selected and locked by default. This automatically hides redundant fields across the combined tables, creating a cleaner data source view that displays only a single set of the unioned fields.
Date ranges and filters
You can limit the data in the blend by applying a date range or filter to one or more tables.
Blending example
The classes, students, and grades blending example demonstrates how to solve a classic data blending use case.