The Dialogflow CX console provides an analytics panel that shows various views for tracking agent performance data. You can track escalations, pages with many no-matches, and webhooks with many failures. You can also filter each view by date range, and all statistics are computed hourly.
Using these analytics views, you can understand your agent performance through different conversation paths and take corrective action to improve performance.
Limitations
For large agents, analytics data takes time to load.
Enable conversation history
The analytics tool uses data from conversation history. It lets you enable or disable logging with the Conversation history agent setting.
Open the analytics panel
To open the analytics panel:
- Go to the Dialogflow CX console.
- Choose your project.
- Select your agent.
- Select the Manage tab.
- Click Analytics.
- Access Legacy Analytics using the link near the top.
Conversation outcomes
This view shows the counts of certain conversation outcomes as a time series chart.
The following table shows the metrics:
| X | Item |
|---|---|
| End Interaction | The number of conversations that were abandoned. |
| Live Agent Handoff | The number of conversations where human escalation was requested. |
| Other | A fail-safe category in case the conversation was not handed to the live agent and did not reach the END SESSION page. For example, if a user says "Hi" and immediately closes the conversation, the conversation is categorized under Other. |

Intent escalations
This view shows a table of intents with the highest number of human escalations. It also shows an escalation trend for a selected intent as a time series chart. If you have labeled certain intents as head intent, you can restrict the view to these intents only.
The following table shows the metrics:
| X | Item |
|---|---|
| Sessions | The total number of sessions in which the intent appeared. |
| Escalation rate | Percentage of sessions that requested human escalation. |
| Turns | The number of conversational turns in which the intent was detected. A single conversation can have multiple matches for one intent. |
| Head intent escalated | Percentage of escalation requests for sessions where the intent was the final head intent. |

Troubleshooting
The troubleshooting section contains multiple views that help you debug common issues with flows and pages.
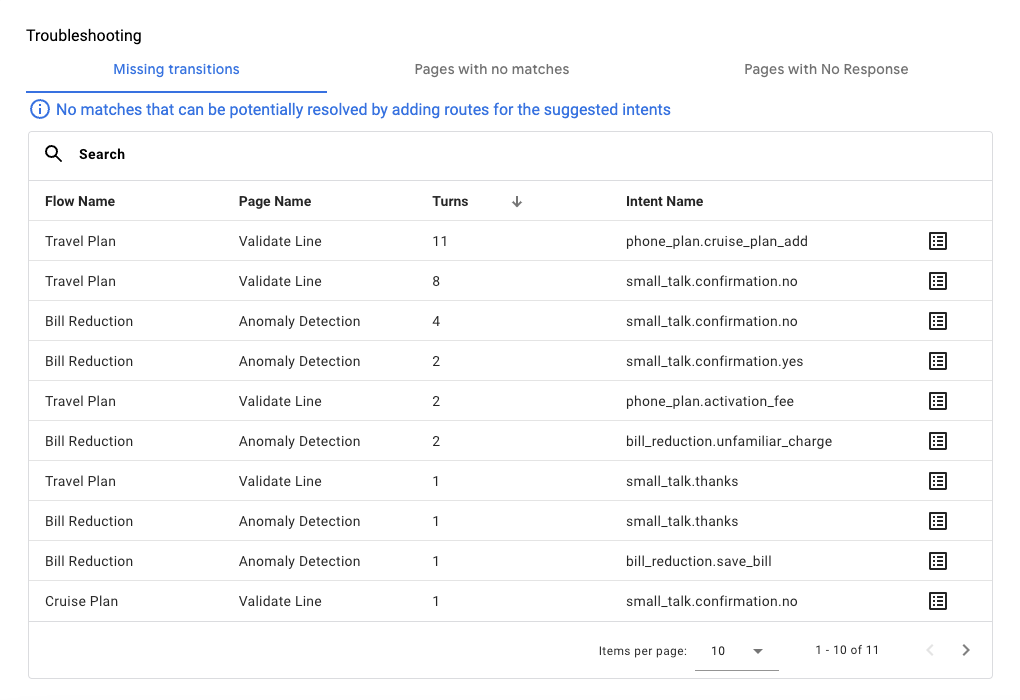
Missing transitions
This view lists pages where an existing intent could have matched but didn't due to missing routes.
The following table shows the metrics:
| X | Item |
|---|---|
| Intent name | The name of the intent that would have matched if it were in scope. |
| Turns | The number of conversational turns that should have matched the intent. |
Pages with no-matches
This view lists pages in tabular form sorted by no-match rates.
The following table shows the metrics:
| X | Item |
|---|---|
| No match rate | Percentage of total conversation turns that resulted in a no-match for the page. |
| No match turns | The total number of conversation turns that resulted in a no-match for the page. |

Pages with no responses
This view lists pages that resulted in no agent response.
The following table shows the metrics:
| X | Item |
|---|---|
| Empty responses | The number of interactions on the page with no agent response. |

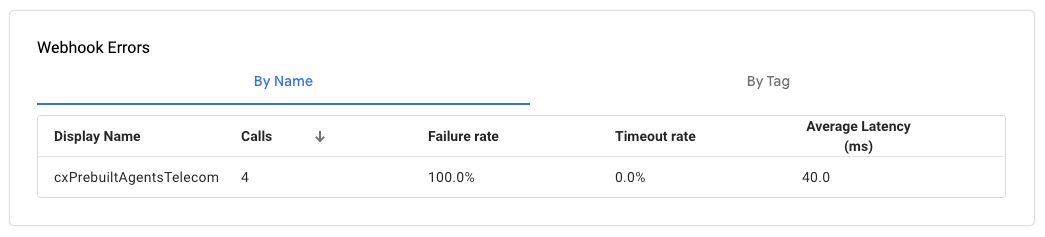
Webhook errors
This view provides webhook errors in tabular form.
You can organize the list by:
- Name: Organized by webhook name.
- Tag: Organized by webhook tags.
The following table shows the metrics:
| X | Item |
|---|---|
| Calls | The number of webhook invocations. |
| Failures | The number of webhook failures excluding timeouts. |
| Timeout rate | Percentage of webhook invocations that timed out. |
| Average latency | Average latency of the webhook invocation. |